This page includes:
About the Incidents page
The Incidents page lets you see a summary of the incidents that were detected by Perception Point X‑Ray in your organization. You can filter the display based on various dimensions, such as time, channel, and scan verdict. By default, the time filter is set to "Last Day".
In the Incidents page, you can also see additional information, such as the most attacked people, the top attacking domains and senders, and as the top impersonated brands.
You can hover over or click much of the data that is shown in the Incidents page - to drill-down and show further details about the associated scans.
|
Note:
|
To show the Incidents page:
In Perception Point X‑Ray, in the left navigation menu, select Insights > Incidents.
|
Any admin user with the "Self Analysis" role [or higher] can access the Incidents page. |
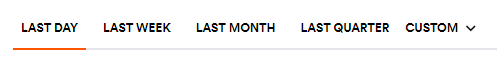
Setting the date range
Use the available controls to set the date range.
Understanding the Incidents page
|
Protection
|
||||||||||||||||||||||||
|
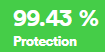
Protection |
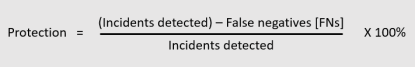
Indicates the level of protection that has been provided by Perception Point X‑Ray during the specified period. The protection level is based on the number of incidents detected and the number of false negative [FN] scan verdicts that were assigned, as follows:
where:
|
|||||||||||||||||||||||
|
Incidents and items scanned
|
||||||||||||||||||||||||
|
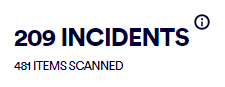
Incidents |
The total number of incidents that were detected during the selected period.
|
|||||||||||||||||||||||
|
Items scanned |
The total number of items that were scanned during the selected period.
|
|||||||||||||||||||||||
|
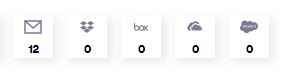
Incidents per channel
|
||||||||||||||||||||||||
|
Incidents per channel |
The number of incidents that were detected in each protected channel - during the selected period.
For details on protected channels, see Bundles and Channels. Actions
|
|||||||||||||||||||||||
|
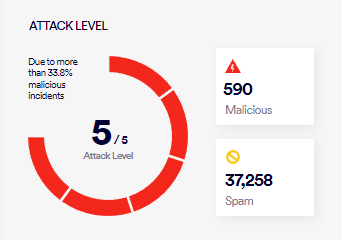
Attack Level
|
||||||||||||||||||||||||
|
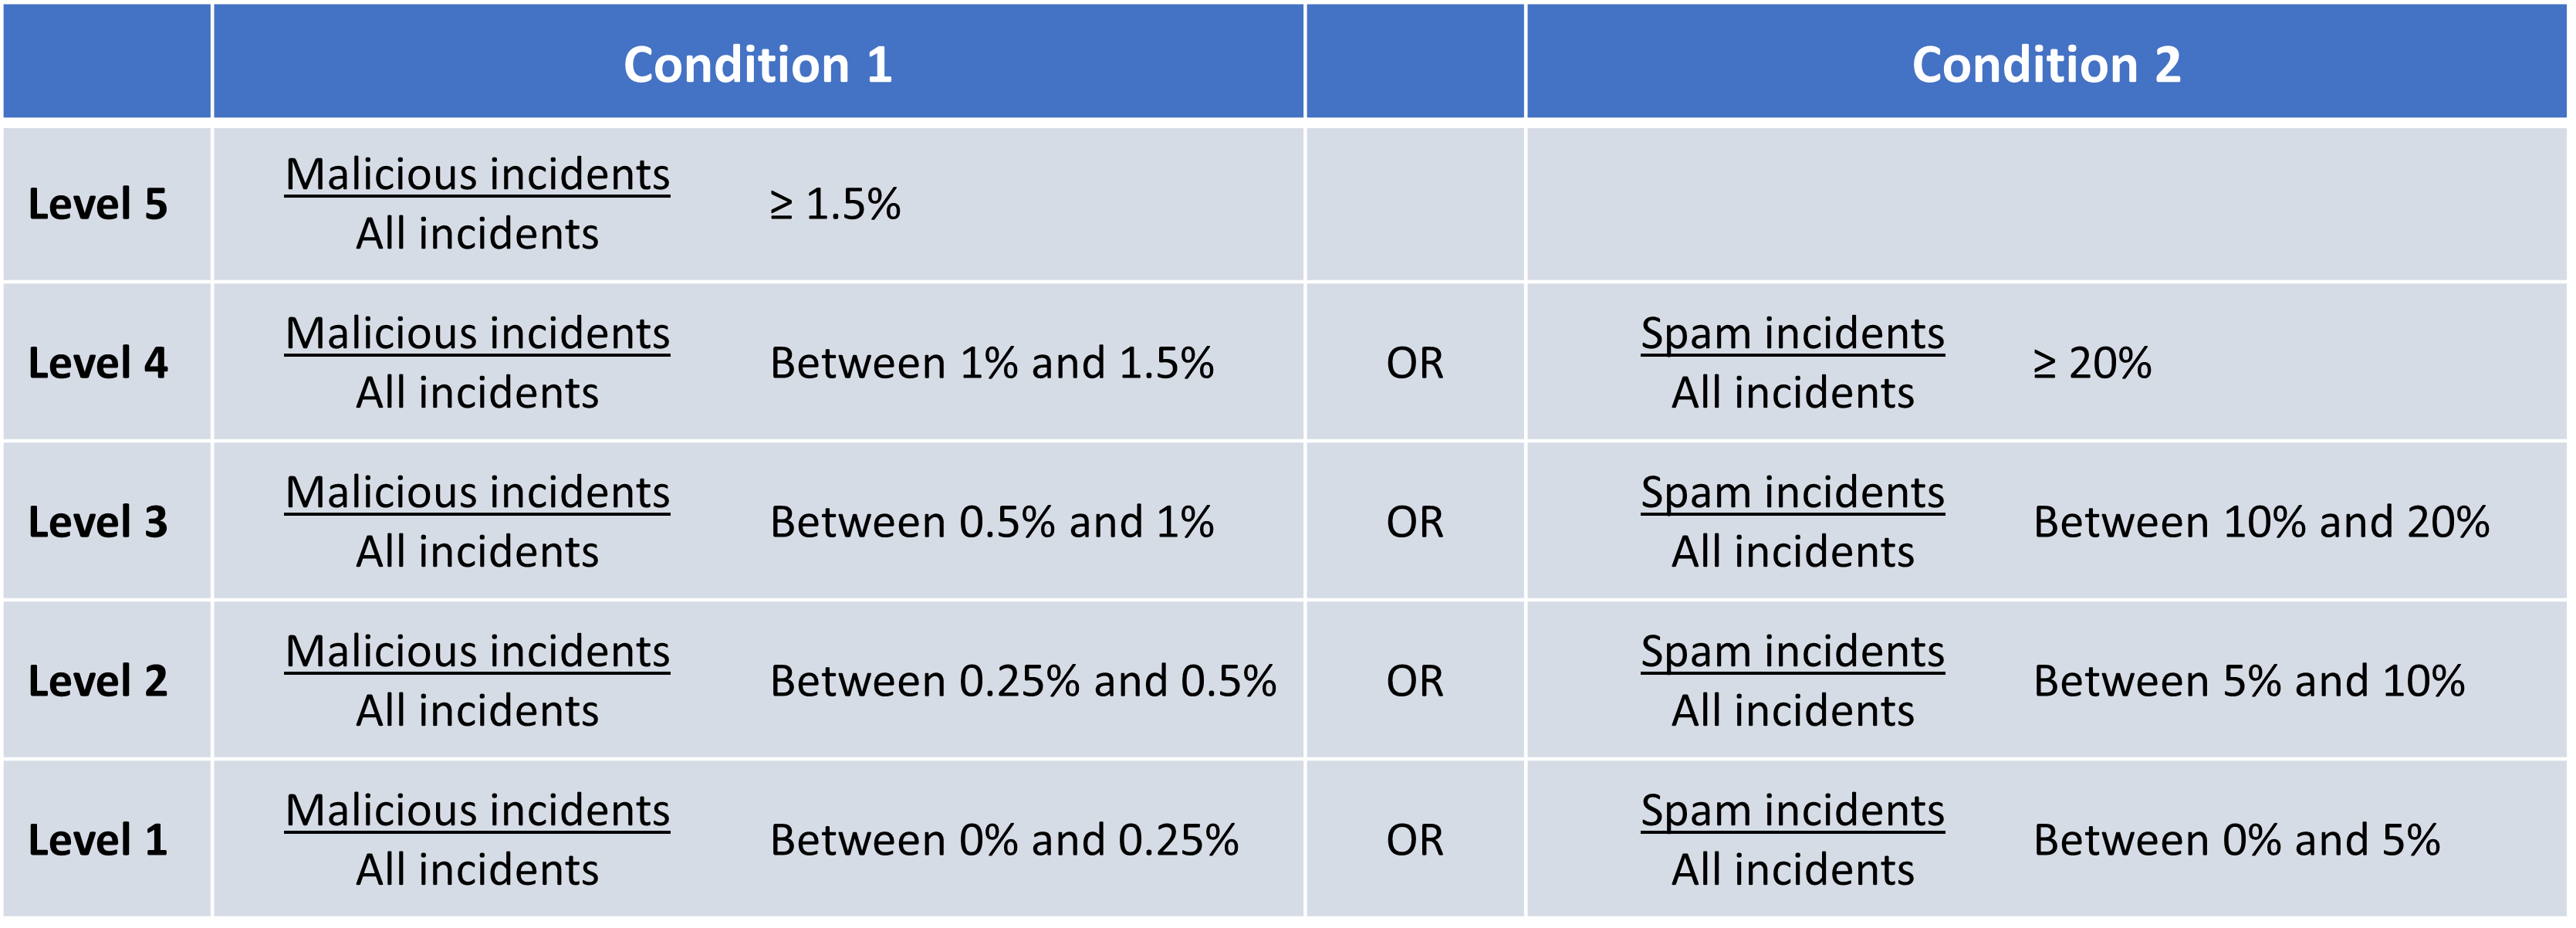
Attack level |
An indication of the number of incidents that were detected by Perception Point X‑Ray, relative to the number of scans that were performed. Both malicious and spam verdicts are included in determining the attack level. The range is from Level 1 to Level 5, where Level 5 is the maximum attack level.
Note: If Condition 1 and Condition 2 fall in different levels, the higher level is applied. |
|||||||||||||||||||||||
|
Incidents |
A breakdown of the scan verdicts that were assigned.
Actions
|
|||||||||||||||||||||||
|
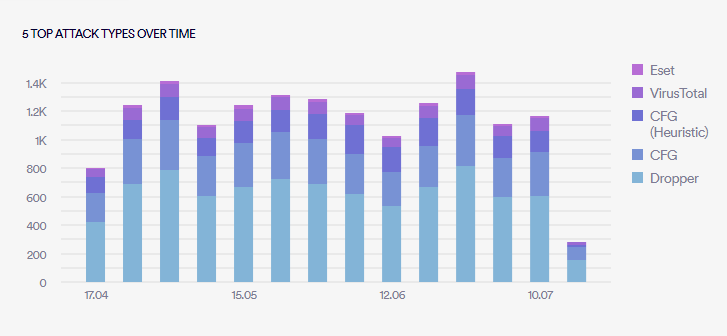
5 Top attack types over time
|
||||||||||||||||||||||||
|
5 Top attack types over time |
Displays the most common attack types that were detected by Perception Point X‑Ray. Actions
|
|||||||||||||||||||||||
|
Top attacked... Shows various attack vectors. You can configure the "top-attacked component". Configuration lets you specify the attack options that will appear in the "top-attacked component, and the order in which these selected options will appear. Click the Settings icon [ |
||||||||||||||||||||||||
|
Top attacked people |
The people who have received the largest quantity of malicious items. It is recommended that you provide these people with additional cyber-security training. |
|||||||||||||||||||||||
|
Top attacking domains/senders |
The domains from which most malware was sent. |
|||||||||||||||||||||||
|
Top impersonated brands |
The brands that were most frequently impersonated. |
|||||||||||||||||||||||
|
Top attacked organizations |
The organizations that were most frequently attacked. |
|||||||||||||||||||||||
|
Top attacked domains |
The domains that were most frequently attacked. |
|||||||||||||||||||||||
|
Top attacked regions |
The regions that were most frequently attacked. |
|||||||||||||||||||||||
|
Top attacked countries |
The countries that were most frequently attacked. |
|||||||||||||||||||||||
|
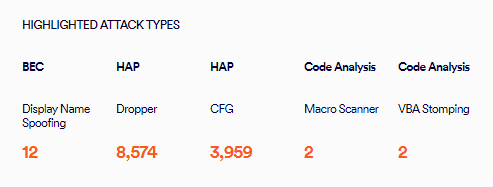
Highlighted attack types
|
||||||||||||||||||||||||
|
|
Various attack types that have been highlighted by the Perception Point IR Team. |
|||||||||||||||||||||||
|
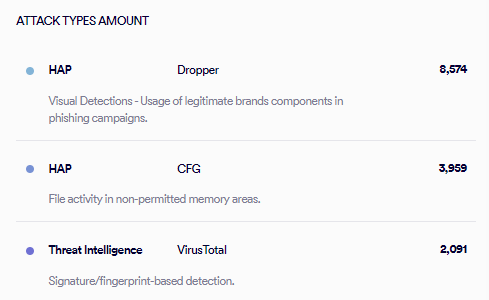
Attack types amount
|
||||||||||||||||||||||||
|
|
Shows the quantity of various attack types that were detected. |
|||||||||||||||||||||||
 ]
]  ]
] ]
] ]
] ]
] 
See also:
